Dell
EMC’s OpenManage Server Administrator (OMSA) application is a
free tool which Dell provide, enabling Dell PowerEdge users to have
greater control over their server. OMSA is downloadable through
Dell’s support website and is compatible with most of the
latest Operating systems and with most PowerEdge chassis. OMSA
compatibility is based on the Dell PowerEdge server’s
generation and the version of Windows Server installed onto the
server. See below to see what server generation Vs. what Operating
System OMSA supports.
|
Dell
PowerEdge Generation
|
Compatible
with Windows Server 2012 & 2012 R2
|
Compatible
with Windows Server 2016
|
|
Dell
PowerEdge 11th Gen (R_10)
|
Yes
|
Not Supported*
|
|
Dell
PowerEdge 12th Gen (R_20)
|
Yes
|
Yes
|
|
Dell
PowerEdge 13th Gen (R_30)
|
Yes
|
Yes
|
|
*There is no
officially supported version of OMSA for Windows Server 2016 for
11th
Gen servers. However, you may be able to install the 12th
generation version for 2016 onto a 11th
Gen server. Please note, compatibility issues may arise from doing
this. Also, iomart (or any company within the iomart group) are
not responsible for any issues caused by performing this action,
and Dell EMC would advise not to perform this action.
|
Please
note that OpenManage Server Administrator is a free piece of software
supplied by Dell EMC. As such iomart (and any company within the
iomart group; including RapidSwitch and Redstation) are not
responsible for this software, nor are they responsible for any
effects downloading, installing or using this software may have on
your platform. We can only advise you to use OMSA and provide you
with advice on how to do so; the choice to download, install and use
the software must be your own. Also, as a managed infrastructure
provider, we do not officially support OMSA; as such we will not be
able to install, use or configure this software.
The
Dell OMSA product is downloaded through Dell’s website, on
their Product Support – Drivers & Downloads page, found
here:
Dell
Product Support - Drivers & Downloads
First,
open up this page on your server’s web-browser.
Once
you are on the Drivers & Downloads page, you now need to select
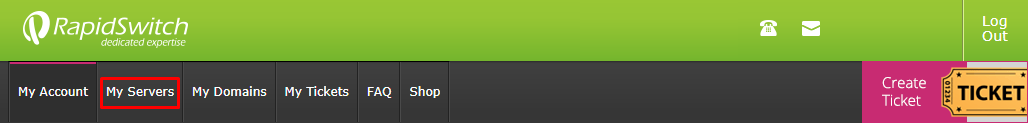
the model of you server. To find the model of your server, while on
the MyServers control panel, press the My Servers button.

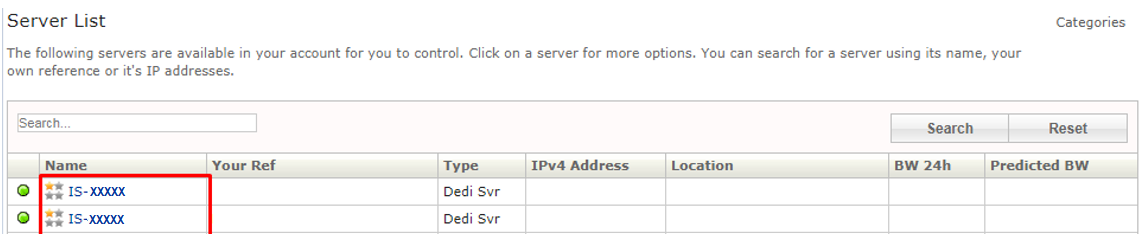
Then
click on the name of the server you wish to install OMSA onto.
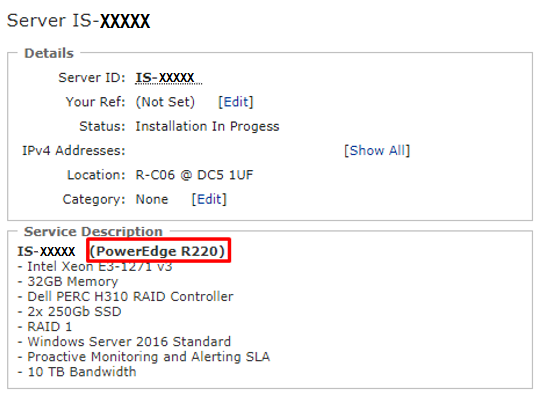
On
this page, under Service Description, you will be able to see the
make and model of this server. In my example below, you can see that
the server is a Dell PowerEdge R220.
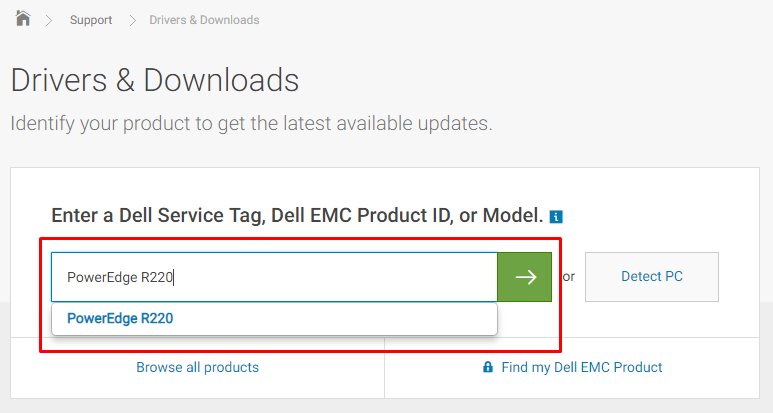
Now
you know the model of your device, you can enter the model of your
server on the Dell Support website, by typing the chassis’
model in the search bar and then pressing the green arrow. Please
type in the chassis model in the same format as shown in the image
below; ‘PowerEdge R---‘.
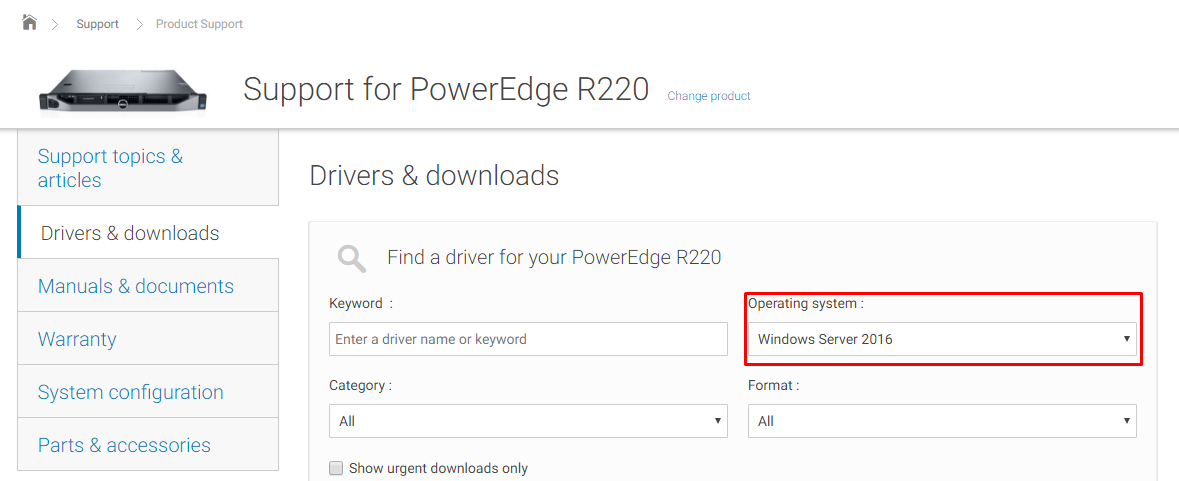
You
should now be presented with the chassis’ Drivers &
Downloads page. If you are presented with a list of search results,
however, please look through the results and click on your chassis
model. Once you are on the Drives & Downloads page you should now
select the Operating System which is installed on the server. Do this
in the Operating System drop-down box.
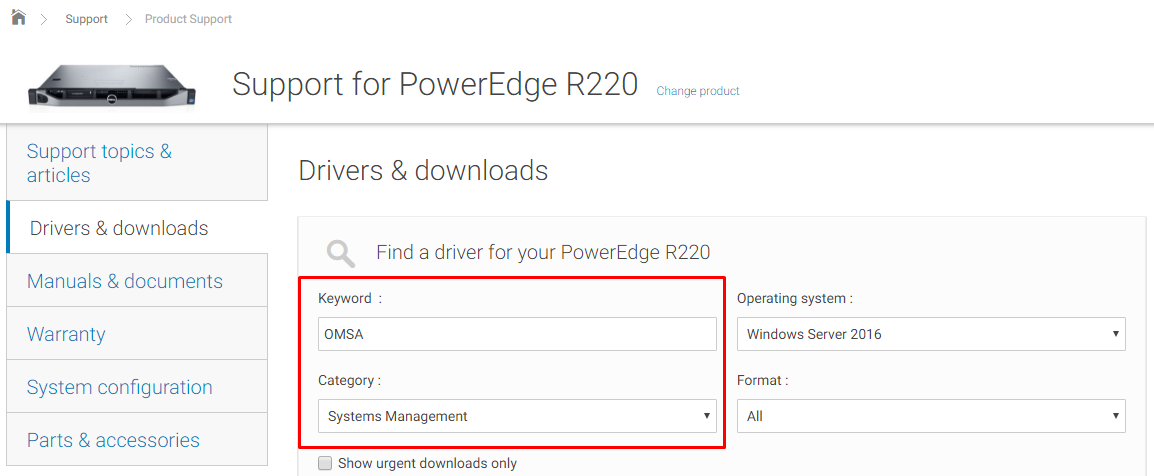
Now
in the Keyword search box enter ‘OMSA’. Then select
Systems Management in the Category drop-down box.
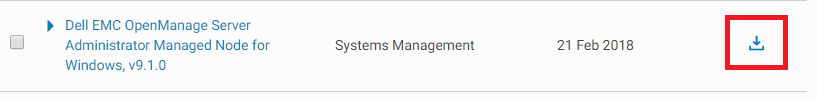
Now
find the Dell EMC OpenManage Server Administrator Managed Node for
Windows within the list of downloadable software and click on the
download button. The software installer file will now download onto
your server.
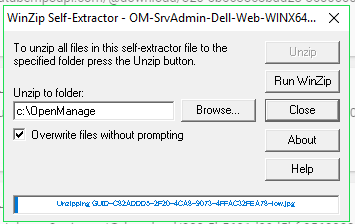
Once
the OMSA file has been downloaded onto your Windows server, you can
begin to install the software. Start by unpacking the downloaded Dell
OpenManage Server Administrator Managed Node file. You will need a
program capable of un-zipping files installed on your server, such as
WinZip.
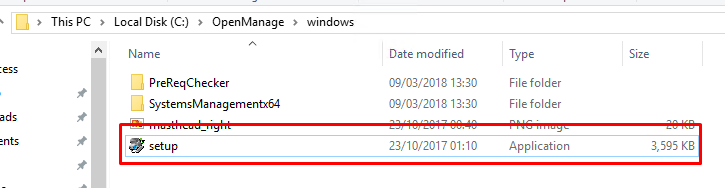
Once
the file is un-zipped, run the autorun.exe/setup.exe file, found
within the OpenManage > Windows folder of the download, to begin
the installation wizard.
If
the Dell Open Manage Install window appears and prompts you to choose
what utility to install, select Dell OpenManage Server Administrator
(Standalone Server Management) and click install.
On
some versions of OMSA, this screen may not appear and you will be
able to skip this step.
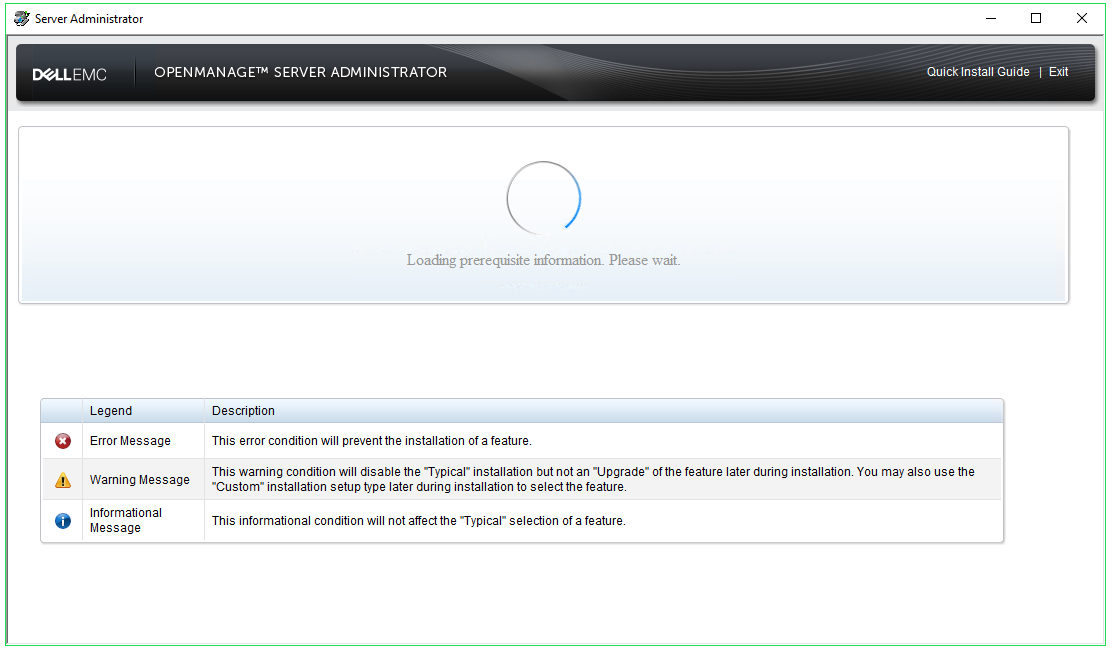
The
Dell OpenManage Server Administrator prerequisite status screen will
now run and display the prerequisite checks for the managed system.
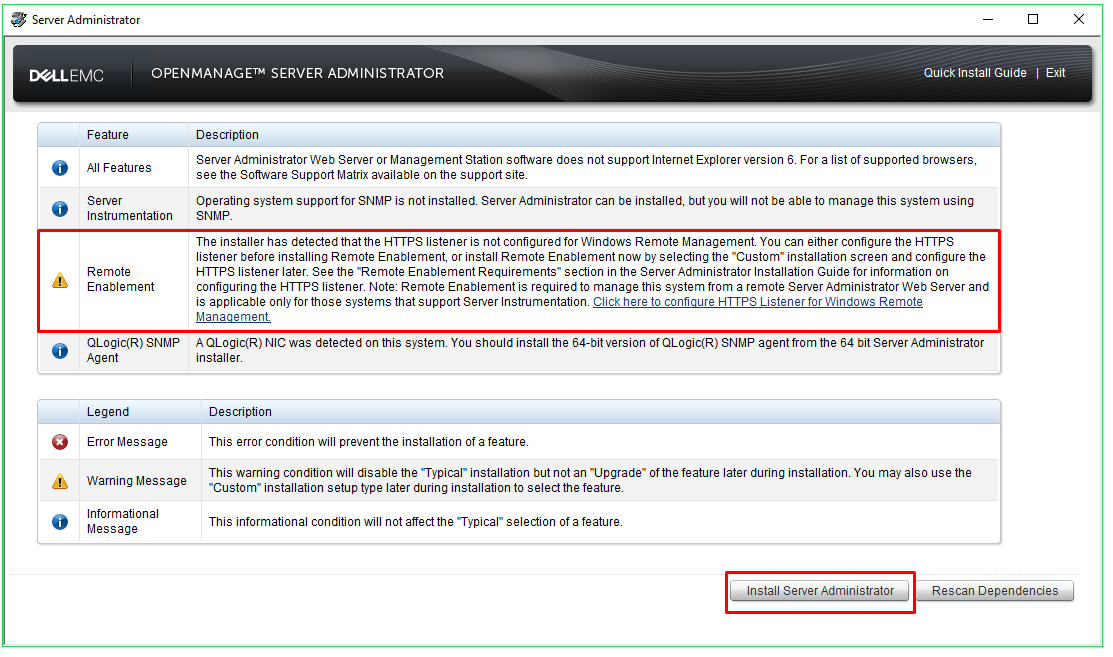
Once
it has completed scanning for prerequisite information, it will list
any errors or warnings that it encountered. You should resolve all
error and warning situations before continuing the installation. Some
errors are correctible by simply clicking on the blue text within the
error. Once you are ready to install OMSA, click Install Server
Administrator.
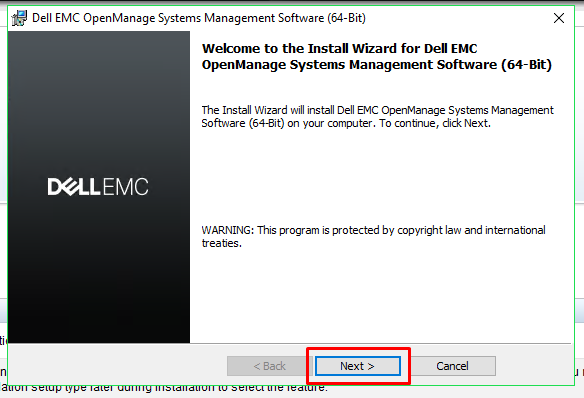
The
Dell OpenManage Server Administrator Install Wizard now appears.
Click Next to begin to proceed.
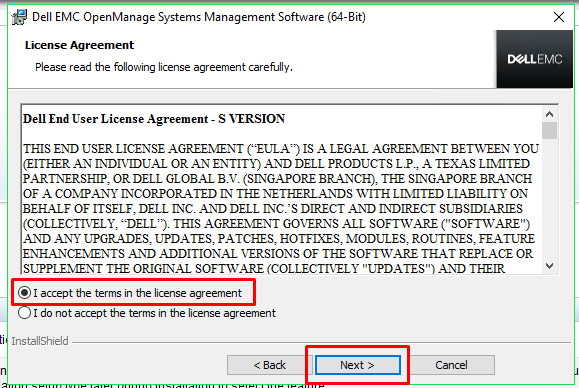
The
Dell End User License Agreement now appears. Please read through this
agreement. If you wish to proceed, select the ‘I Accept’
option and then click
Next.
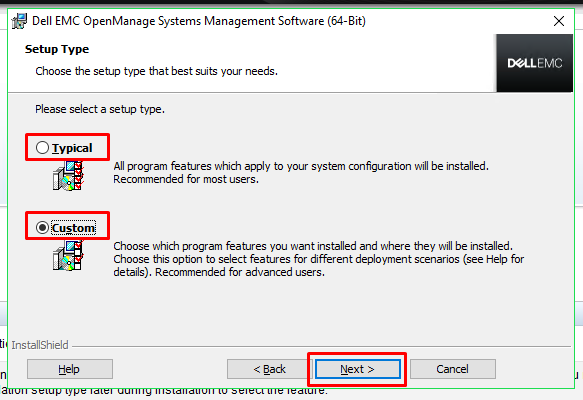
You
now need to select the type of installation required. There are two
options:
Typical: All program features will be installed in the default
install location.
Custom: Choose which features you want installed and choose the
installation directory.
If
you wish to perform a typical install, meaning you wish to install
all features and you are happy for the software to be installed in
the default location, select Typical and then press next.
If
you wish to perform a custom installation, select Custom and click
Next to continue.
This
guide will show you how to perform a Custom install; however, if you
are performing a Typical install, once you have pressed next, simply
press install to start the installation.
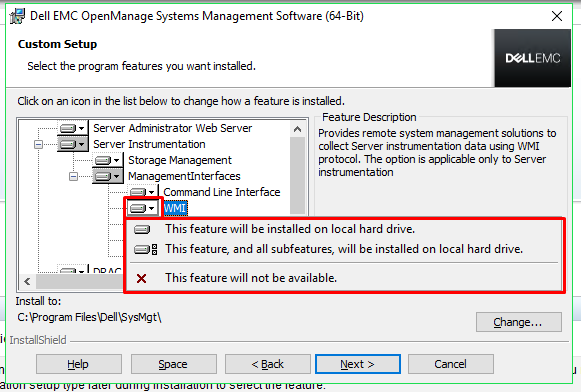
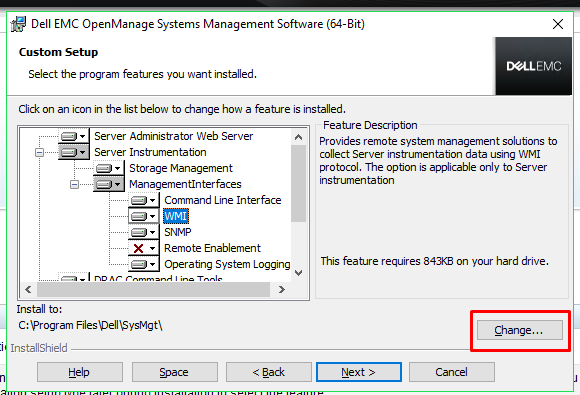
If
you have selected a custom install, you can now select the features
to install. If you want to change a feature so that it is set to be
installed or set to be not to be installed, simply click on the icon
next to the feature, and then select the option you wish to change it
to.
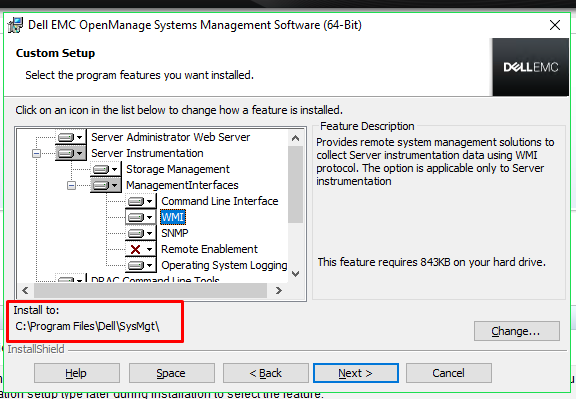
Once
you have finished selecting which features you wish to install, you
can now check the destination folder. This current install
destination is shown under ‘Install to’.
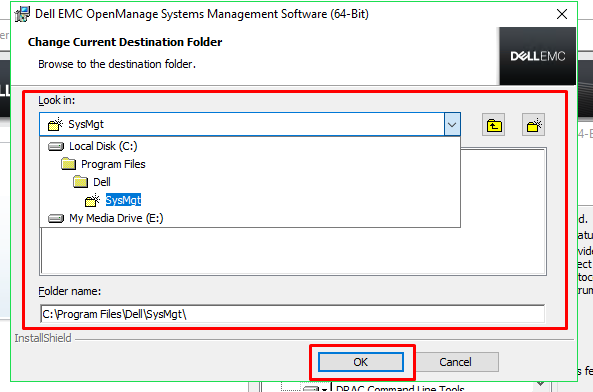
If
you wish to change the folder where the software will be installed,
press the change button, then us the box that appears to select the
destination folder and then press OK.
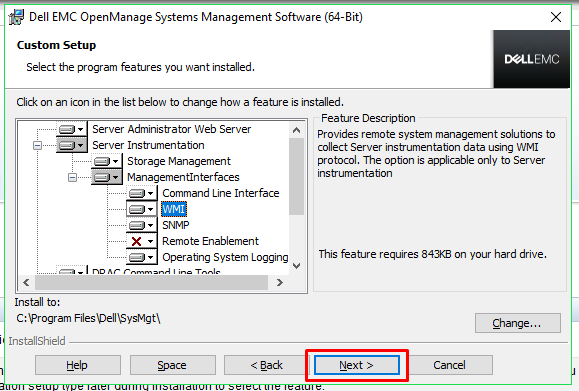
When
you have finished selecting which features you wish to be installed
and once you have selected the destination folder, press Next to
proceed.
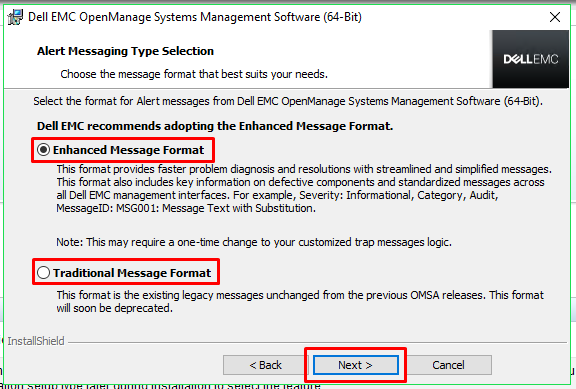
If
you are performing a custom installation, you may now be able to
select the Alert Messaging Type. There are two options:
You
can see the descriptions for each format within the installation
wizard box. Select which message format you wish to use and then
press Next.
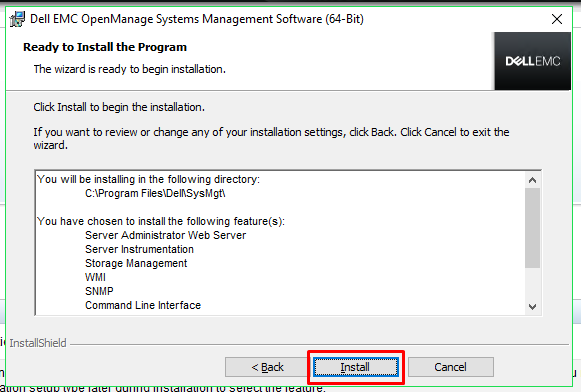
You
can now start the installation. To begin the installation, click
Install.
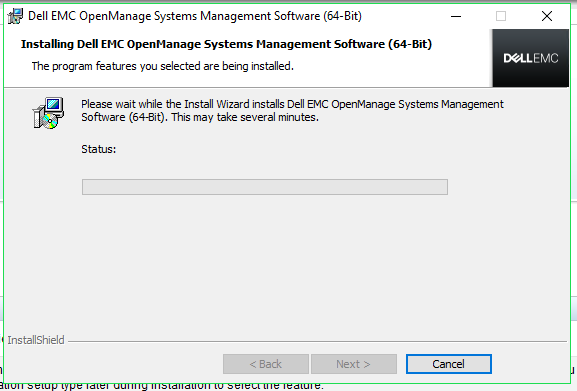
The
installation process will begin.
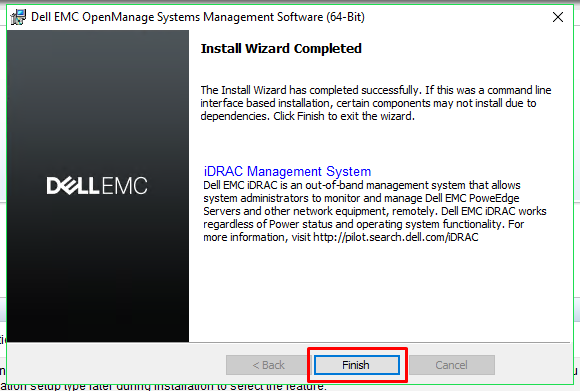
Once
the installation has completed, click
Finish to exit the installer.
Dell
EMC’s OpenManage System Administrator will now be installed
onto your server. You can then use this software to manage and
monitor the hardware within this server. You may need to restart your
server before you can access the OpenManage application, however.
If
you have any further questions about OMSA, please look through our
FAQ section. If our FAQ page does not have the answer, please feel
free to raise a support ticket, and we will be happy to help.